4.5. Styling Vector Layers
We’ll start with a working example that displays building footprints in a vector layer over a base layer. Open your text editor and save the following as
map.htmlin the root of your workshop directory:<!DOCTYPE html> <html> <head> <title>My Map</title> <link rel="stylesheet" href="openlayers/theme/default/style.css" type="text/css"> <style> #map-id { width: 512px; height: 256px; } </style> <script src="openlayers/lib/OpenLayers.js"></script> </head> <body> <h1>My Map</h1> <div id="map-id"></div> <script> var nyc = new OpenLayers.Bounds( -74.032, 40.685, -73.902, 40.876 ); var map = new OpenLayers.Map("map-id", { projection: new OpenLayers.Projection("EPSG:4326"), maxExtent: nyc, restrictedExtent: nyc, maxResolution: 0.0005, numZoomLevels: 5 }); var base = new OpenLayers.Layer.WMS( "New York City", "/geoserver/wms", {layers: "tiger-ny"} ); map.addLayer(base); var center = new OpenLayers.LonLat( -73.987, 40.737); map.setCenter(center,3); map.addControl(new OpenLayers.Control.LayerSwitcher()); var landmarks = new OpenLayers.Layer.Vector("NY Landmarks", { strategies: [new OpenLayers.Strategy.BBOX()], protocol: new OpenLayers.Protocol.WFS({ version: "1.1.0", url: "/geoserver/wfs", featureType: "poly_landmarks", featureNS: "http://www.census.gov", srsName: "EPSG:4326" }) }); map.addLayer(landmarks); </script> </body> </html>
Open this
map.htmlfile in your browser to see orange landmarks over the base layer: http://localhost:8080/ol_workshop/map.html. You can use the layer switcher control we added to change the visibility of the vector layer.With a basic understanding of styling in OpenLayers, we can create an
OpenLayers.StyleMapthat displays landmarks in different colors based on theCFCCcode. In your map initialization code, replace the constructor for thelandmarkslayer with the following:var landmarks = new OpenLayers.Layer.Vector("NY Landmarks", { strategies: [new OpenLayers.Strategy.BBOX()], protocol: new OpenLayers.Protocol.WFS({ version: "1.1.0", url: "/geoserver/wfs", featureType: "poly_landmarks", featureNS: "http://www.census.gov", srsName: "EPSG:4326" }), styleMap: new OpenLayers.StyleMap({ "default": new OpenLayers.Style({ strokeColor: "white", strokeWidth: 1 }, { rules: [ new OpenLayers.Rule({ filter: new OpenLayers.Filter.Logical({ type: OpenLayers.Filter.Logical.OR, filters: [ new OpenLayers.Filter.Comparison({ type: OpenLayers.Filter.Comparison.EQUAL_TO, property: "CFCC", value: "D82" }), new OpenLayers.Filter.Comparison({ type: OpenLayers.Filter.Comparison.EQUAL_TO, property: "CFCC", value: "D83" }), new OpenLayers.Filter.Comparison({ type: OpenLayers.Filter.Comparison.EQUAL_TO, property: "CFCC", value: "D84" }), new OpenLayers.Filter.Comparison({ type: OpenLayers.Filter.Comparison.EQUAL_TO, property: "CFCC", value: "D85" }) ] }), symbolizer: { fillColor: "#B4DFB4", strokeColor: "#88B588", strokeWidth: 2 } }), new OpenLayers.Rule({ elseFilter: true, symbolizer: { fillColor: "navy" } }) ] }) }) });
See how an
OpenLayers.Filter.Logical.ORfilter groups several filters to allow a rule to match different conditions. That is, style all the features where the fieldCFCC` has the values ``D80toD85.Save your changes and open
map.htmlin your browser: http://localhost:8080/ol_workshop/map.html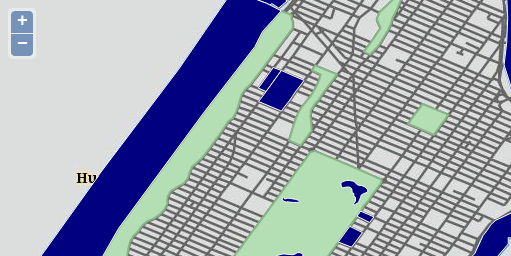
Landmarks related with green areas.
Tasks
- Go to the GeoServer web interface and review the SLD style applied to the
poly_landmarks. You’ll see the first rule is similar to the style applied on this exercise. - Try to reproduce the rest of the rules of the layer, so you have a similar vector representation of this WMS layer.
- Change the base layer to just load the
giant_polygonWMS layer and try to render the roads as vectors using filter by scale, and loading on top the labels as a WMS layer. You will have to create a new SLD style to just render the labels. Pay attention to the image below layers to see how to obtain that effect.
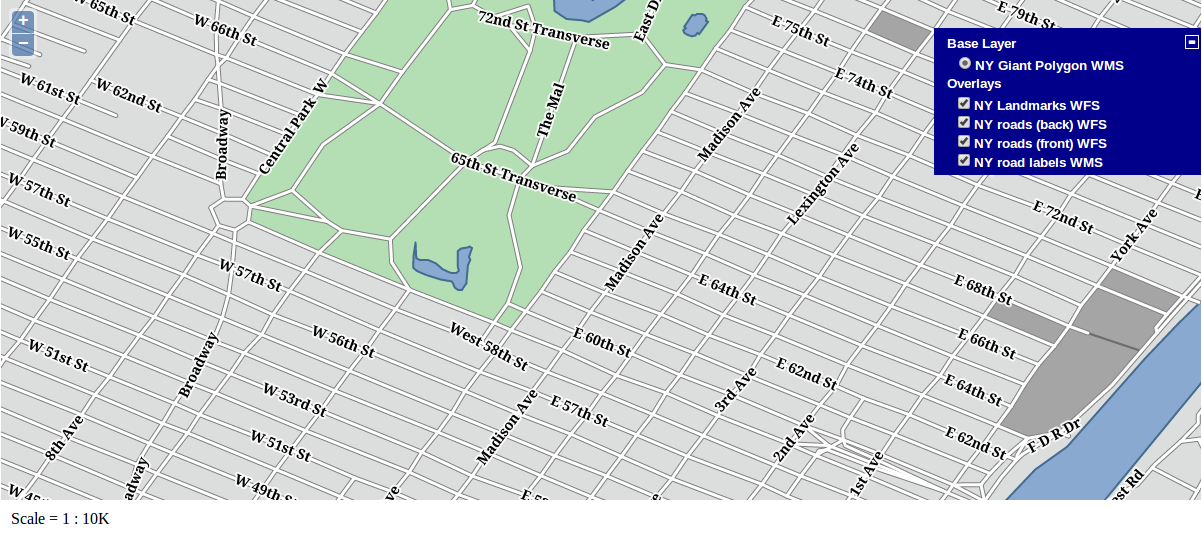
Rendering landmarks and roads as vectors